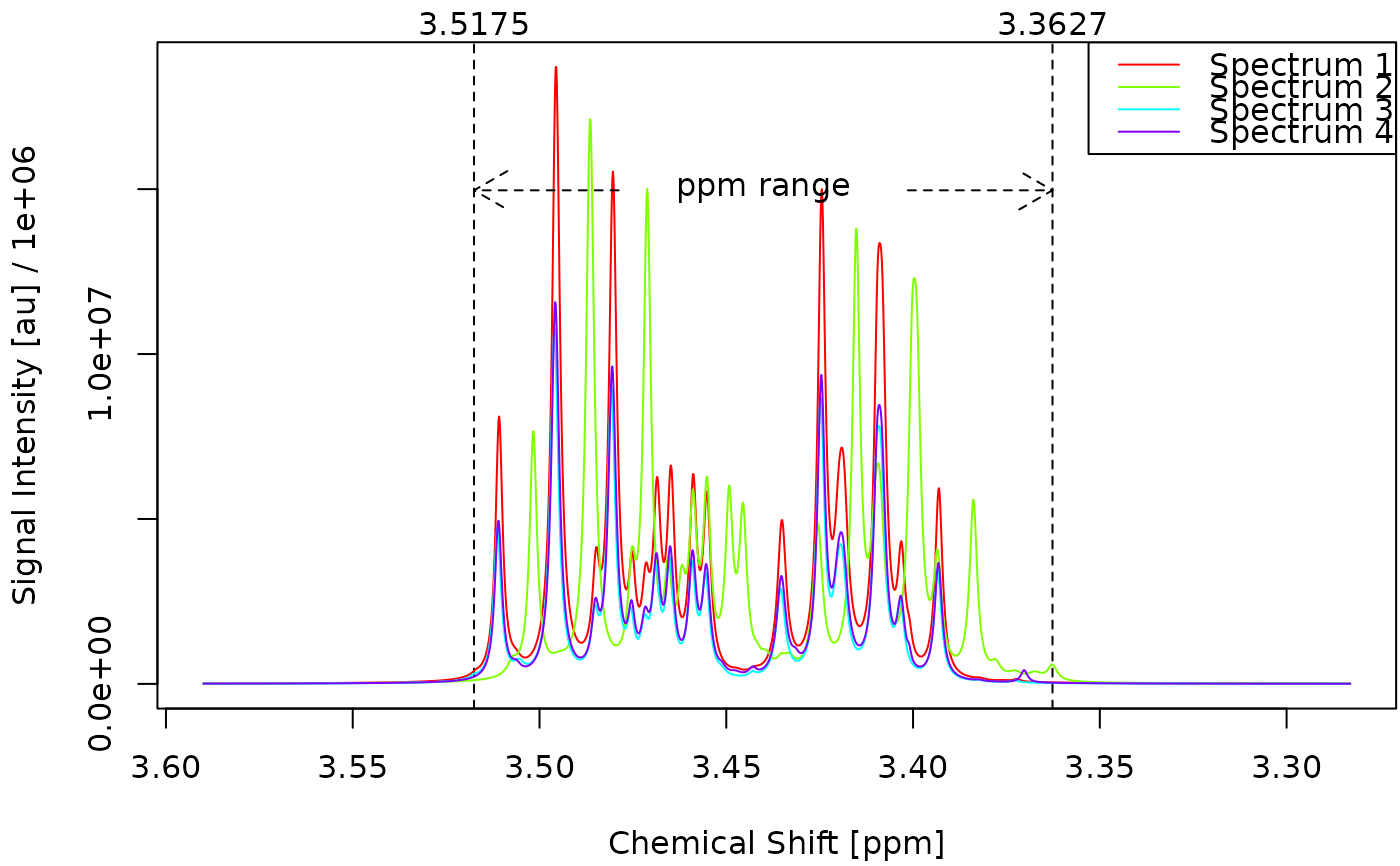
Plot a set of deconvoluted spectra.
Arguments
- obj
An object of type
decons0,decons1ordecons2. For details see Metabodecon Classes.- ...
Additional arguments passed to the conversion function.
- foc_rgn
Numeric vector of length 2 specifying the focus region in ppm (e.g.
c(3.55, 3.35)). If NULL (default), the full spectrum is shown.- what
Which signal to plot:
"supal"(aligned superposition, default with fallback to"sup"then"si"),"sup"(superposition) or"si"(raw).- sfy
Scaling factor for the y-axis.
- cols
Character vector of colors, one per spectrum. Defaults to
rainbow(n).- names
Character vector of legend labels. Defaults to spectrum names.
- xlab
Label for the x-axis.
- ylab
Label for the y-axis.
- mar
A numeric vector of length 4, which specifies the margins of the plot.
- lgd
Logical or list. If TRUE, a legend is drawn at "topright" with
cex = 0.8. If a list, its elements are passed tolegend()to override position, size, etc. Setshow = FALSEinside the list (or passlgd = FALSE) to hide.
See also
plot_spectrum() for a much more sophisticated plotting routine
suitable for plotting a single spectrum.
Examples
obj <- deconvolute(sim[1:4], sfr = c(3.55, 3.35))
#> 2026-07-20 06:55:52.84 Starting deconvolution of 4 spectra using 1 worker
#> 2026-07-20 06:55:52.84 Starting deconvolution of sim_01 using R (legacy) backend
#> 2026-07-20 06:55:52.84 Removing water signal
#> 2026-07-20 06:55:52.84 Removing negative signals
#> 2026-07-20 06:55:52.84 Smoothing signals
#> 2026-07-20 06:55:52.85 Starting peak selection
#> 2026-07-20 06:55:52.85 Detected 314 peaks
#> 2026-07-20 06:55:52.85 Removing peaks with low scores
#> 2026-07-20 06:55:52.85 Removed 287 peaks
#> 2026-07-20 06:55:52.85 Initializing Lorentz curves
#> 2026-07-20 06:55:52.85 MSE at peak tiplet positions: 4.0838805770844048836921
#> 2026-07-20 06:55:52.85 Refining Lorentz Curves
#> 2026-07-20 06:55:52.85 MSE at peak tiplet positions: 0.1609359876216345797140
#> 2026-07-20 06:55:52.86 MSE at peak tiplet positions: 0.0228015051613790278862
#> 2026-07-20 06:55:52.86 MSE at peak tiplet positions: 0.0071638016610617982066
#> 2026-07-20 06:55:52.86 Formatting return object as decon2
#> 2026-07-20 06:55:52.86 Finished deconvolution of sim_01
#> 2026-07-20 06:55:52.86 Starting deconvolution of sim_02 using R (legacy) backend
#> 2026-07-20 06:55:52.86 Removing water signal
#> 2026-07-20 06:55:52.86 Removing negative signals
#> 2026-07-20 06:55:52.86 Smoothing signals
#> 2026-07-20 06:55:52.87 Starting peak selection
#> 2026-07-20 06:55:52.87 Detected 316 peaks
#> 2026-07-20 06:55:52.87 Removing peaks with low scores
#> 2026-07-20 06:55:52.87 Removed 286 peaks
#> 2026-07-20 06:55:52.87 Initializing Lorentz curves
#> 2026-07-20 06:55:52.87 MSE at peak tiplet positions: 3.8338943428876719465848
#> 2026-07-20 06:55:52.87 Refining Lorentz Curves
#> 2026-07-20 06:55:52.87 MSE at peak tiplet positions: 0.1289481941626757499630
#> 2026-07-20 06:55:52.88 MSE at peak tiplet positions: 0.0135651899090413925741
#> 2026-07-20 06:55:52.88 MSE at peak tiplet positions: 0.0025556755331531126781
#> 2026-07-20 06:55:52.89 Formatting return object as decon2
#> 2026-07-20 06:55:52.89 Finished deconvolution of sim_02
#> 2026-07-20 06:55:52.89 Starting deconvolution of sim_03 using R (legacy) backend
#> 2026-07-20 06:55:52.89 Removing water signal
#> 2026-07-20 06:55:52.89 Removing negative signals
#> 2026-07-20 06:55:52.89 Smoothing signals
#> 2026-07-20 06:55:52.89 Starting peak selection
#> 2026-07-20 06:55:52.89 Detected 333 peaks
#> 2026-07-20 06:55:52.90 Removing peaks with low scores
#> 2026-07-20 06:55:52.90 Removed 308 peaks
#> 2026-07-20 06:55:52.90 Initializing Lorentz curves
#> 2026-07-20 06:55:52.90 MSE at peak tiplet positions: 1.4917065120183621296235
#> 2026-07-20 06:55:52.90 Refining Lorentz Curves
#> 2026-07-20 06:55:52.90 MSE at peak tiplet positions: 0.0569971157280155932279
#> 2026-07-20 06:55:52.90 MSE at peak tiplet positions: 0.0065629979536274835050
#> 2026-07-20 06:55:52.90 MSE at peak tiplet positions: 0.0013913916281140697225
#> 2026-07-20 06:55:52.90 Formatting return object as decon2
#> 2026-07-20 06:55:52.90 Finished deconvolution of sim_03
#> 2026-07-20 06:55:52.90 Starting deconvolution of sim_04 using R (legacy) backend
#> 2026-07-20 06:55:52.91 Removing water signal
#> 2026-07-20 06:55:52.91 Removing negative signals
#> 2026-07-20 06:55:52.91 Smoothing signals
#> 2026-07-20 06:55:52.91 Starting peak selection
#> 2026-07-20 06:55:52.91 Detected 325 peaks
#> 2026-07-20 06:55:52.91 Removing peaks with low scores
#> 2026-07-20 06:55:52.91 Removed 299 peaks
#> 2026-07-20 06:55:52.91 Initializing Lorentz curves
#> 2026-07-20 06:55:52.91 MSE at peak tiplet positions: 2.2382155282476525748336
#> 2026-07-20 06:55:52.91 Refining Lorentz Curves
#> 2026-07-20 06:55:52.92 MSE at peak tiplet positions: 0.0843491698981613108321
#> 2026-07-20 06:55:52.92 MSE at peak tiplet positions: 0.0101688144550079323514
#> 2026-07-20 06:55:52.92 MSE at peak tiplet positions: 0.0031861616084395993388
#> 2026-07-20 06:55:52.92 Formatting return object as decon2
#> 2026-07-20 06:55:52.92 Finished deconvolution of sim_04
#> 2026-07-20 06:55:52.92 Finished deconvolution of 4 spectra in 0.08 secs
plot_spectra(obj)