Helper function of plot_lorentz_curves_save_as_png().
Should not be called directly by the user.
Calculates the lorentz curves of each investigated spectrum.
This function has been deprecated with metabodecon version v1.4.3 and will be removed with version 2.0.0.
![[Deprecated]](figures/lifecycle-deprecated.svg)
Arguments
- deconv_result
A list as returned by
generate_lorentz_curves()orMetaboDecon1D().- number_of_files
Number of spectra to analyze
Value
If deconv_result holds the result of a single deconvolution, a matrix
containing the generated Lorentz curves is returned, where each row depicts
one Lorentz curve. If deconv_result is a list of deconvoluted spectra, a
list of such matrices is returned.
Author
2020-2021 Martina Haeckl: initial version.
2024-2025 Tobias Schmidt: Minor updates to pass CRAN checks
Examples
## -~-~-~-~-~-~-~-~-~-~-~-~-~-~-~-~-~-~-~-~-~-~-~-~-~-~-~-~-~-~-~-~-~-~-~-~-
## Deconvolute the spectra in folder "bruker/sim_subset" into a list of
## Lorentz Curves (specified via the parameters A, lambda and x_0).
## -~-~-~-~-~-~-~-~-~-~-~-~-~-~-~-~-~-~-~-~-~-~-~-~-~-~-~-~-~-~-~-~-~-~-~-~-
decons <- generate_lorentz_curves_sim(sim[1:2])
decon0 <- decons[[1]]
## -~-~-~-~-~-~-~-~-~-~-~-~-~-~-~-~-~-~-~-~-~-~-~-~-~-~-~-~-~-~-~-~-~-~-~-~-
## Calculate the corresponding y values at each ppm value for each Lorentz
## Curve. I.e. you get a matrix of dimension n x m for each deconvolution,
## where n is the number of Lorentz Curves and m is the number of ppm values.
## -~-~-~-~-~-~-~-~-~-~-~-~-~-~-~-~-~-~-~-~-~-~-~-~-~-~-~-~-~-~-~-~-~-~-~-~-
yy <- calculate_lorentz_curves(decons)
y1 <- yy[[1]]
dim(y1)
#> [1] 27 2048
## -~-~-~-~-~-~-~-~-~-~-~-~-~-~-~-~-~-~-~-~-~-~-~-~-~-~-~-~-~-~-~-~-~-~-~-~-
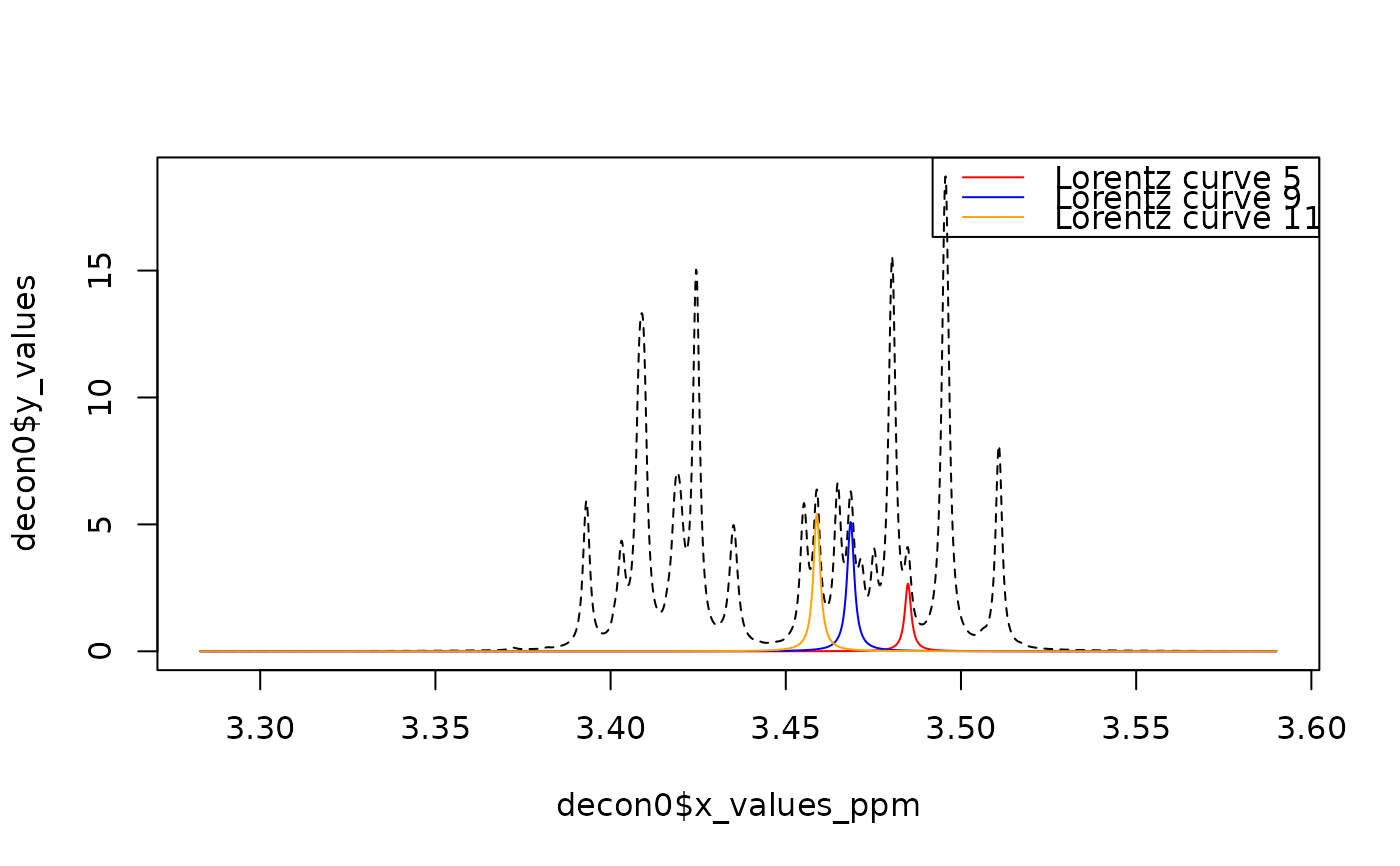
## Visualize the 5th, 9th and 11th Lorentz curve.
## -~-~-~-~-~-~-~-~-~-~-~-~-~-~-~-~-~-~-~-~-~-~-~-~-~-~-~-~-~-~-~-~-~-~-~-~-
nrs <- c(5, 9, 11)
col <- c("red", "blue", "orange")
desc <- paste("Lorentz curve", nrs)
plot(decon0$x_values_ppm, decon0$y_values, type = "l", lty = 2)
for (i in 1:3) lines(decon0$x_values_ppm, y1[nrs[i], ], col = col[i])
legend("topright", legend = desc, col = col, lty = 1)